

- Education
- Forex Technical Analysis
- Chart Patterns
- Continuation Patterns
- Bearish Rectangle
Rectangle Pattern (Bearish): Forex Chart Pattern
Chart patterns help traders anticipate price direction before it happens, and the bearish rectangle pattern is one of the most reliable continuation signals in technical analysis. Recognizing this pattern early can help you time entries, manage risk, and avoid getting caught on the wrong side of a downtrend. Here's what you need to know.
DEFINITION:
The rectangle graphical price pattern serves for existing trend confirmation. The bearish version is usually formed in a downtrend and signals the trend’s direction will prevail after its occurrence on the chart.
Key Moments
- A bearish rectangle forms when price consolidates between two parallel horizontal support and resistance lines during a downtrend.
- The pattern typically signals a temporary pause before the prevailing downward trend resumes with renewed selling pressure.
- Trading volume usually contracts within the rectangle and expands sharply once price breaks below the support line.
- Traders often use the rectangle's height to project a measured price target after the downside breakout occurs.
- False breakouts can occur, so confirming the breakout with volume and a retest of support improves reliability.
What is Bearish Rectangle Pattern
A bearish rectangle pattern is a continuation formation that appears when price moves sideways within a well-defined downtrend. It develops as buyers and sellers reach temporary equilibrium, pushing price back and forth between two parallel trendlines. These trendlines act as horizontal support and resistance, creating a rectangular shape on the price chart.
This pattern belongs to a broader family of continuation patterns, which suggest that the existing trend is likely to persist. Unlike reversal patterns, the bearish rectangle indicates a pause rather than a change in market direction. Traders watch for this consolidation because it often precedes another leg lower in price.
The rectangle typically forms over several trading sessions, giving the pattern time to mature and gain reliability. Its horizontal boundaries make it easier to identify than more complex chart formations like triangles or flags. Because of this clarity, the bearish rectangle is popular among both novice and experienced technical analysts.
Understanding this pattern matters because it offers a structured way to anticipate continued downside movement in a market. It also helps traders distinguish between genuine trend continuation and a potential reversal in price direction. This distinction becomes clearer once you examine how the pattern should be interpreted in practice.
Bearish Rectangle Pattern Formation
The formation process begins with an established downtrend that loses momentum and starts trading sideways. Price bounces between a lower support line and an upper resistance line, creating the rectangle's boundaries. Each touch of these lines strengthens the pattern's visual structure and increases its technical significance.
As the rectangle develops, trading volume typically contracts, signaling temporary indecision among market participants. This quiet phase often frustrates short-term traders but rewards those who wait patiently for a decisive breakout. Once sellers overwhelm buyers again, price breaks decisively below the rectangle's lower support boundary.
Confirmation of the breakout usually requires a candle closing clearly below support on above-average trading volume. Some traders also wait for a retest of the broken support level, which often turns into new resistance. This retest offers a lower-risk entry point for traders who missed the initial breakout move.
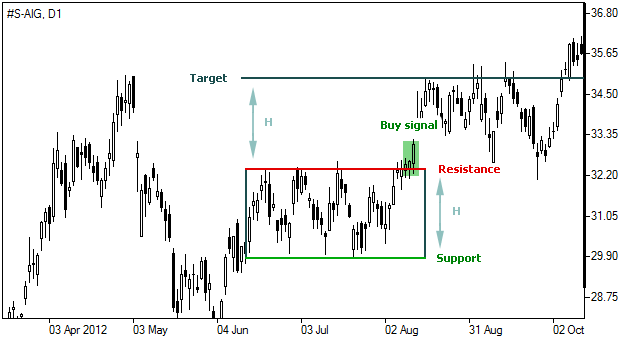
Once the breakout is confirmed, traders often measure the rectangle's height and project that distance downward from the breakout point. This calculation provides an estimated price target for the continuation move that follows. Combining this target with proper risk management helps traders navigate the bearish rectangle pattern with greater confidence.

Interpretation of Bearish Rectangle
Interpreting a bearish rectangle correctly starts with confirming that price was already in a downtrend before consolidation began. This prior trend provides essential context, since the pattern's reliability depends heavily on the strength of that decline. Without a clear preceding downtrend, the rectangle may simply represent random price movement rather than a true continuation setup.
Volume behavior offers another important clue for interpreting the pattern's validity and eventual outcome. Volume usually declines as price oscillates between support and resistance, reflecting reduced conviction from both buyers and sellers. A sudden volume spike on the downside breakout confirms that sellers have regained control of the market.
The number of touches on each trendline also affects how traders interpret the pattern's strength and reliability. More touches on support and resistance generally indicate a more established and dependable rectangle formation. Analysts often wait for at least two or three touches on each boundary before trusting the pattern's signal.
Traders also interpret the rectangle's duration, since longer consolidations tend to produce more significant breakouts afterward. A prolonged sideways period suggests greater accumulated selling pressure waiting to be released once support breaks. This buildup often results in a faster and more pronounced decline once the breakout is confirmed.
Target price
Following a bearish rectangle pattern formation the price is generally believed to fall at least to its target level, calculated as follows:
T = S – H, Where:T – target price;
S – support level (pattern’s low);
H – pattern’s height (distance between support and resistance).
Forex Indicators FAQ
What is a Forex Indicator?
Forex technical analysis indicators are regularly used by traders to predict price movements in the Foreign Exchange market and thus increase the likelihood of making money in the Forex market. Forex indicators actually take into account the price and volume of a particular trading instrument for further market forecasting.
What are the Best Technical Indicators?
Technical analysis, which is often included in various trading strategies, cannot be considered separately from technical indicators. Some indicators are rarely used, while others are almost irreplaceable for many traders. We highlighted 5 the most popular technical analysis indicators: Moving average (MA), Exponential moving average (EMA), Stochastic oscillator, Bollinger bands, Moving average convergence divergence (MACD).
How to Use Technical Indicators?
Trading strategies usually require multiple technical analysis indicators to increase forecast accuracy. Lagging technical indicators show past trends, while leading indicators predict upcoming moves. When selecting trading indicators, also consider different types of charting tools, such as volume, momentum, volatility and trend indicators.
Do Indicators Work in Forex?
There are 2 types of indicators: lagging and leading. Lagging indicators base on past movements and market reversals, and are more effective when markets are trending strongly. Leading indicators try to predict the price moves and reversals in the future, they are used commonly in range trading, and since they produce many false signals, they are not suitable for trend trading.

Not sure about your Forex skills level?
Take a Test and We Will Help You With The Rest
You can see the graphical object on the price chart by downloading one of the trading terminals offered by IFC Markets.



Was this article helpful?

 You can study CFD trading more thoroughly and see CFD trading examples in the section How To Trade CFDs Visit Educational Center