

- Education
- Forex Technical Analysis
- Technical Indicators
- Oscillators
- MACD Indicator
MACD Indicator (Moving Average Convergence Divergence)
The MACD (Moving Average Convergence Divergence) indicator is one of the most widely used momentum tools in forex and CFD trading, helping traders spot shifts in trend direction before they become obvious on price charts. This guide breaks down what MACD is, how to read its signals, and how to apply it to real trading decisions.
Key Moments
- MACD combines two EMAs and a signal line to reveal both the direction and the strength of price momentum at a glance.
- A signal line crossover, where the MACD line crosses the signal line, is the indicator's most commonly traded setup.
- Crossovers above or below the zero line confirm whether the broader trend is bullish or bearish.
- Divergence between MACD and price action can warn of a weakening trend before it reverses on the chart.
- MACD works best when combined with price action, support and resistance, or another confirming indicator rather than used alone.
What is MACD Indicator
MACD is a momentum indicator that measures the relationship between a fast and a slow exponential moving average of price. It was developed to help traders identify changes in trend strength, direction, and duration without relying on raw price alone. Because it reacts faster than a simple moving average, MACD is popular across forex, stocks, and crypto markets.
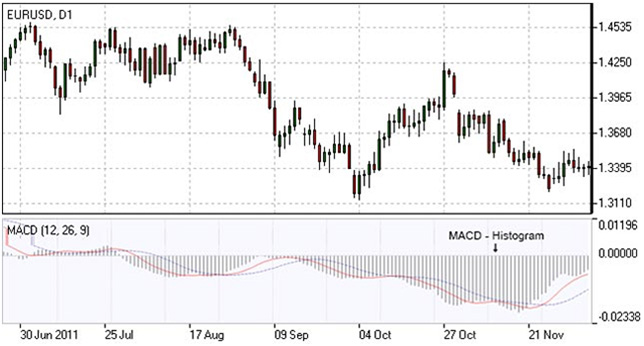
The indicator consists of three components displayed together on a chart. The MACD line itself is the difference between the 12-period and 26-period EMAs of the asset's closing price. The signal line is a 9-period EMA of the MACD line, and the histogram visually represents the gap between the two.
Traders use MACD primarily to time entries and exits around momentum shifts rather than to predict exact price levels. It is considered a lagging indicator because it is built from moving averages, so it confirms trends more reliably than it predicts brand-new ones. Combining MACD with price structure helps offset this lag.
MACD Indicator
How to Use MACD Indicator
Three main signals generated by the MACD indicator (blue line) are crossovers with the signal line (red line), crossovers with the x-axis, and divergence patterns.
Signal Line Crossovers
Crossovers between the MACD line and the signal line highlight shifts in market momentum.
- Bullish Signal: If the MACD line is rising faster than the Signal line and crosses it from below, the signal is interpreted as bullish and suggests acceleration of price growth.
- Bearish Signal: If the MACD line is falling faster than the Signal line and crosses it from above, the signal is interpreted as bearish and suggests extension of price losses.
How to Use: Look for confirmation from price action or other indicators, such as a breakout above resistance for a bullish signal or a breakdown below support for a bearish signal. Avoid acting on the crossover alone — factor in volume and candlestick formations.
Zero Line Crossovers
Crossovers with the x-axis (zero line) confirm the broader trend direction.
- Bullish Signal: A bullish signal appears if the MACD line climbs above zero.
- Bearish Signal: A bearish signal presents if the MACD line falls below zero.
How to Use: Use the zero line crossover as a second layer of confirmation for trades based on other signals, such as candlestick patterns or trendline breaks.
Convergence/Divergence
Comparing the MACD line's direction to price action reveals whether the current move is confirmed or losing strength.
- Convergence: If the MACD line is trending in the same direction as the price, the pattern is known as convergence, which confirms the price move.
- Divergence: If they move in opposite directions, the pattern is divergence — for example, if price reaches a new high but the indicator does not, this may signal weakness ahead.
How to Use: Treat divergence as an early warning rather than a standalone trade trigger — confirm with a signal line or zero line crossover before acting.
MACD Indicator Formula (MACD Calculation)
The MACD indicator formula is calculated by subtracting the 26-period exponential moving average from a 12-period moving average, and to eliminate random fluctuations, the obtained values are smoothed with a 9-period exponential moving average.
The MACD indicator formula is:
MACD line = 12-period EMA – 26-period EMA
Signal line = 9-period EMA
Histogram = MACD line – Signal line
MACD Trading Strategy
MACD strategy is used to determine the buy and sell signals for the financial instrument. The MACD values range above and below the zero line. When the MACD and Signal lines are far above the zero line, this shows an overbought condition and indicates a sell signal. When the two lines are well below the zero line, this shows an oversold condition and indicates a buy signal.
In the MACD system, it is very important to consider MACD histogram. The histogram includes vertical bars which show the difference between two MACD lines. It is above the zero line when the MACD lines are in positive alignment, meaning that the faster line is above the slower line. And when the histogram is above the zero line, but starts to move down toward the zero line, this indicates that the uptrend is weakening. Accordingly, when the histogram is below the zero line and starts to rise toward the zero line, this shows a weakness in a downtrend.
Signals are shown on the zero line crossings. Though buy or sell signals are generated only when the histogram crosses the zero line, the latter provides earlier warnings of the trend than the crossover signals. The histogram turns toward the zero line always precede the actual crossover signals.
Conclusion
MACD remains one of the most reliable ways to read momentum shifts across forex, stocks, and crypto markets. By watching signal line crossovers, zero line position, and divergence together, traders can build a more complete picture of where a trend stands and where it might be heading next.
FAQs
What does MACD stand for?
MACD stands for Moving Average Convergence Divergence, a momentum indicator built from the relationship between two exponential moving averages of price.
What is the MACD Indicator formula?
The MACD indicator formula is:
MACD line = 12-period EMA – 26-period EMA
Signal line = 9-period EMA
Histogram = MACD line – Signal line
What is a good MACD setting for day trading?
The default 12, 26, 9 setting works for most timeframes, though some day traders use faster settings like 5, 13, 1 for quicker signals on shorter charts.
Can MACD be used alone to trade?
MACD can generate signals on its own, but because it lags price, most traders combine it with support and resistance or another indicator to reduce false signals.
What is MACD divergence?
MACD divergence occurs when price and the MACD line move in opposite directions, often signaling that the current trend is losing momentum.
Does MACD work on all timeframes?
MACD can be applied to any timeframe, but signals on higher timeframes tend to be more reliable than those on very short, noisy charts.

Not sure about your Forex skills level?
Take a Test and We Will Help You With The Rest
You can see the graphical object on the price chart by downloading one of the trading terminals offered by IFC Markets.



Was this article helpful?

 You can study CFD trading more thoroughly and see CFD trading examples in the section How To Trade CFDs Visit Educational Center