

- Education
- Forex Technical Analysis
- Technical Indicators
- Bill Williams Indicators
- Acceleration/Deceleration Oscillator
AC Indicator - Accelerator Oscillator
The Accelerator Oscillator indicator helps traders spot shifts in market momentum before price itself confirms the move. Developed by Bill Williams, it measures acceleration and deceleration of the driving force behind a trend. This guide explains what the indicator is, how to trade with it, its formula, and where to apply it.
DEFINITION:
The Accelerator Oscillator is an indicator that measures the acceleration or deceleration of the current market driving force. The principle of operation of the Accelerator Oscillator is based on the assumption of its creator Bill Williams that before the change of the direction of the price movement, the momentum of its change should fall.
Key Moments
- The Accelerator Oscillator indicator measures the acceleration or deceleration of current market momentum ahead of an actual price move.
- Bill Williams designed the indicator to compare present momentum against a five-period moving average of that same momentum reading.
- Green and red histogram bars signal whether momentum is speeding up or slowing down relative to the previous bar.
- Zero-line crossovers on the histogram often act as early warning signs of a potential trend reversal or continuation.
- Traders commonly pair the Accelerator Oscillator with price action and other Bill Williams tools for stronger trade confirmation.
What is Accelerator Oscillator Indicator
The Accelerator Oscillator indicator is a momentum tool that reveals whether the driving force behind a price move is speeding up or slowing down. It was introduced by trader Bill Williams as part of his broader toolkit for reading market psychology through momentum shifts. Unlike lagging indicators, the AC is designed to anticipate turns in momentum before they show up clearly in price.
The indicator plots as a histogram that oscillates above and below a horizontal zero line on a separate chart window. Each bar is colored green when it is higher than the prior bar, and red when it is lower than the prior bar. This simple color logic gives traders a quick visual read on whether acceleration is building or fading in the current move.
Because the AC reacts to changes in momentum rather than price alone, it often shifts direction slightly ahead of the more widely used Awesome Oscillator. This makes it useful as an early warning tool rather than a standalone trading signal. Most traders treat AC readings as one input within a broader technical analysis framework.
Beginners often confuse the Accelerator Oscillator with standard momentum or MACD-style indicators, but its calculation method sets it apart. Where many oscillators track price momentum directly, the AC tracks the momentum of momentum itself, effectively measuring acceleration. This layered calculation is what allows it to flag subtle shifts in market driving force earlier than many alternatives.
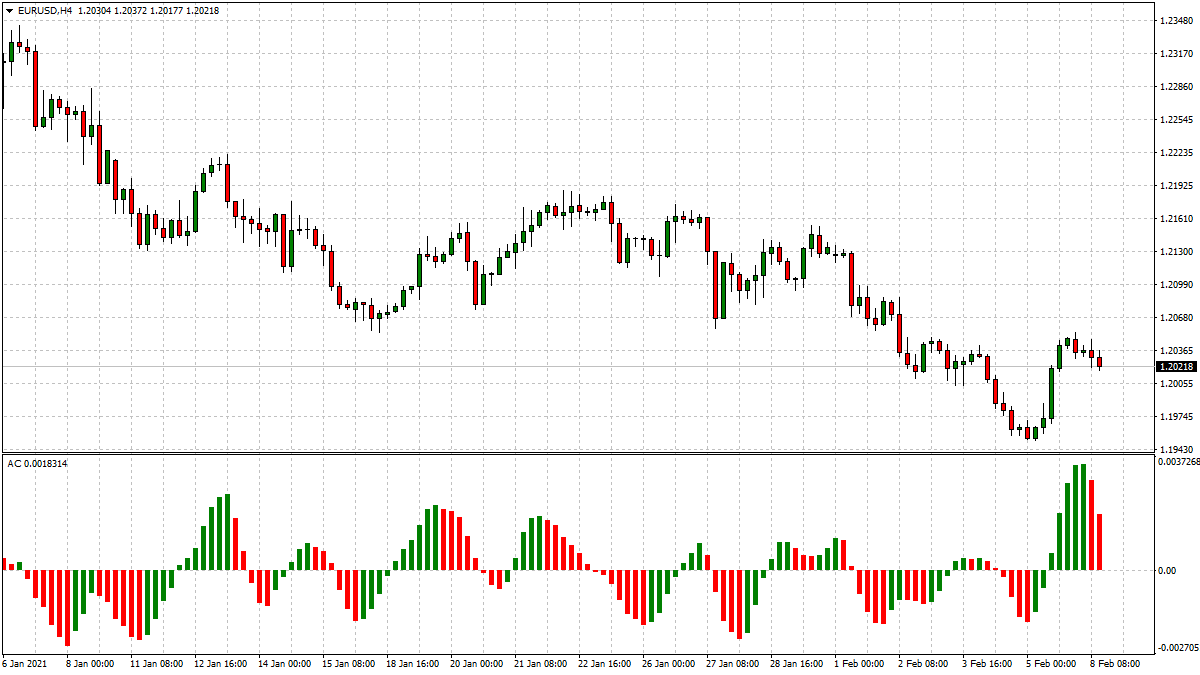
Accelerator Oscillator
How to Trade Using Accelerator Oscillator Indicator
Trading the Accelerator Oscillator indicator effectively combines reading its histogram signals with sound platform setup and risk management. The steps below walk through the practical process from opening an account to placing a trade based on AC readings.
1. Open a Trading Account
Start by registering with a broker that offers the technical tools needed for momentum-based strategies like the Accelerator Oscillator. You can open trading account in just a few minutes to access live charts and indicator libraries.
2. Choose Your Trading Platform
Select a platform that supports the Accelerator Oscillator alongside other Bill Williams tools for confirmation. Popular options include MetaTrader 4, MetaTrader 5, and NetTradeX, each offering built-in access to the indicator.
3. Add the Accelerator Oscillator to Your Chart
Open your chosen instrument's chart and apply the Accelerator Oscillator from the platform's indicator list. It will appear as a separate histogram window below the main price chart, ready for analysis.
4. Watch for Zero-Line Crossovers and Color Changes
Monitor the histogram for crossovers above or below the zero line, since these often mark shifts in momentum direction. A change from red to green bars, or the reverse, can signal that acceleration is starting to turn.
5. Confirm Signals with Price Action
Cross-check any AC signal against recent price action, support and resistance levels, or other indicators before acting. This extra confirmation step helps filter out weaker signals that may not lead to a sustained move.
6. Set Entry, Stop-Loss, and Take-Profit Levels
Once a signal is confirmed, define a clear entry point along with a stop-loss to limit downside risk. Set a realistic take-profit target based on recent volatility and nearby support or resistance zones.
In the Accelerator Oscillator formula the AC bar chart is the difference between the value of 5/34 of the driving force bar chart and 5-period simple moving average, taken from that bar chart.
AO = SMA(median price, 5)-SMA(median price, 34)AC = AO-SMA(AO, 5)
The Accelerator Oscillator indicator is calculated as a difference between the Awesome Oscillator (AO) and the 5-period moving average of the AO.
Conclusion
The Accelerator Oscillator indicator gives traders an early signal of shifting momentum, helping them anticipate rather than merely react to price moves. Its histogram-based readout of acceleration and deceleration makes it accessible even for beginners still learning technical analysis. Used alongside price action and confirming indicators, it becomes a valuable addition to a broader trading strategy.
As with any single indicator, the Accelerator Oscillator works best as part of a disciplined, risk-managed approach rather than in isolation. Combining it with sound platform tools and a clear trading plan gives traders a more complete picture of market momentum. Practicing on a demo account first can help build confidence before applying AC-based signals to live trades.
Forex Indicators FAQ
What is a Forex Indicator?
Forex technical analysis indicators are regularly used by traders to predict price movements in the Foreign Exchange market and thus increase the likelihood of making money in the Forex market. Forex indicators actually take into account the price and volume of a particular trading instrument for further market forecasting.
What are the Best Technical Indicators?
Technical analysis, which is often included in various trading strategies, cannot be considered separately from technical indicators. Some indicators are rarely used, while others are almost irreplaceable for many traders. We highlighted 5 the most popular technical analysis indicators: Moving average (MA), Exponential moving average (EMA), Stochastic oscillator, Bollinger bands, Moving average convergence divergence (MACD).
How to Use Technical Indicators?
Trading strategies usually require multiple technical analysis indicators to increase forecast accuracy. Lagging technical indicators show past trends, while leading indicators predict upcoming moves. When selecting trading indicators, also consider different types of charting tools, such as volume, momentum, volatility and trend indicators.
Do Indicators Work in Forex?
There are 2 types of indicators: lagging and leading. Lagging indicators base on past movements and market reversals, and are more effective when markets are trending strongly. Leading indicators try to predict the price moves and reversals in the future, they are used commonly in range trading, and since they produce many false signals, they are not suitable for trend trading.

Not sure about your Forex skills level?
Take a Test and We Will Help You With The Rest
You can see the graphical object on the price chart by downloading one of the trading terminals offered by IFC Markets.



Was this article helpful?

 You can study CFD trading more thoroughly and see CFD trading examples in the section How To Trade CFDs Visit Educational Center