- Analytics
- Trading News
- Bitcoin at $67K: Key Levels, Technicals and What's Driving the Price
Bitcoin at $67K: Key Levels, Technicals and What's Driving the Price

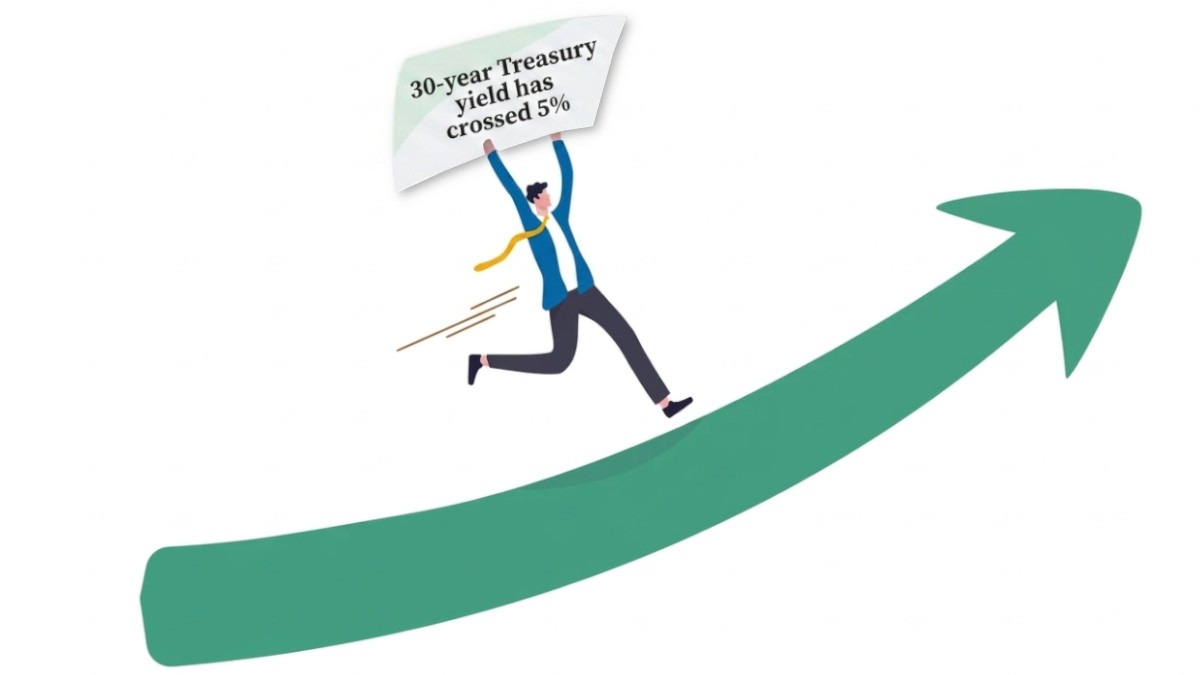
Bitcoin is in a later stage of post-halving cycle, meaning prices peak and start pulling back. Big institutional buyers are also stepping back: U.S. Bitcoin ETF inflows have slowed significantly in recent weeks, and institutional buying momentum across the board has eased. The Fed is showing no intention of cutting rates before 2027, while gold and oil are the standout performers of 2026 so far, leaving Bitcoin as the worst performing major asset this year.
Some believe the arrival of regulated crypto products means Bitcoin won't fall as hard as in previous cycles, while others think the massive rally to $126K last year has simply run out of steam.
Current Technical Signals
- RSI (14-day): 40.32 is in neutral zone, but trending toward oversold. No confirmed reversal signal yet.
- MACD: Bearish crossover in place. Price momentum continues to deteriorate on the daily timeframe.
- 50-day SMA: Slope is falling, meaning short-term trend is weakening.
- 200-day SMA: Has been declining since March 27, 2026 it’s a notable bearish shift in the longer-term trend.
- Fear & Greed Index: 8 - Extreme Fear, such indicators precede a market recovery when panic selling has exhausted itself.
Key Levels tO Trade Around
Resistance: $69,000 → $72,000–$74,000 → $80,000
Support: $67,500 → $67,000 → $64,000–$65,000
Classic Pivot (daily): around $68,500, trading below this level maintains the bearish short-term bias.
Fibonacci support zone: $67,470–$68,683 price is now compressing within this range.
Bullish
Price holds above $67,500, reclaims $69,000, and builds toward $72,000–$74,000. A break above $74,000 would open the door toward $80,000.
Bearish
A confirmed break below $67,000 accelerates selling toward $64,000–$65,000, with the $60,000 zone as the next major structural support.
Takeaway
The technical picture is firmly bearish in the short term: falling SMAs, weak MACD, and 81% of composite signals pointing to selling. But with the Fear & Greed Index at extreme fear (8), a strong counter-rally is possible if key support at $66,600 - $67,500 holds.
New powerful tool, BTCUSD Technicals
New powerful tool, BTCUSD Technicals
Live Technical Analysis with instant forecast using most popular indicators and oscillators.
Try Now
If you don’t find a way to make money while you sleep, you will work until you die.- Warren Buffett