- Análisis
- Análisis Técnico
Gas Natural Análisis Técnico - Gas Natural Trading: 2022-11-16
Gas Natural Resumen de análisis técnico
Por encima de 7,02
Buy Stop
Por debajo de 5,25
Stop Loss
| Indicador | Señal |
| RSI | Neutral |
| MACD | Comprar |
| MA(200) | Neutral |
| Fractals | Neutral |
| Parabolic SAR | Comprar |
| Bollinger Bands | Neutral |
Gas Natural Análisis gráfico
Gas Natural Análisis técnico
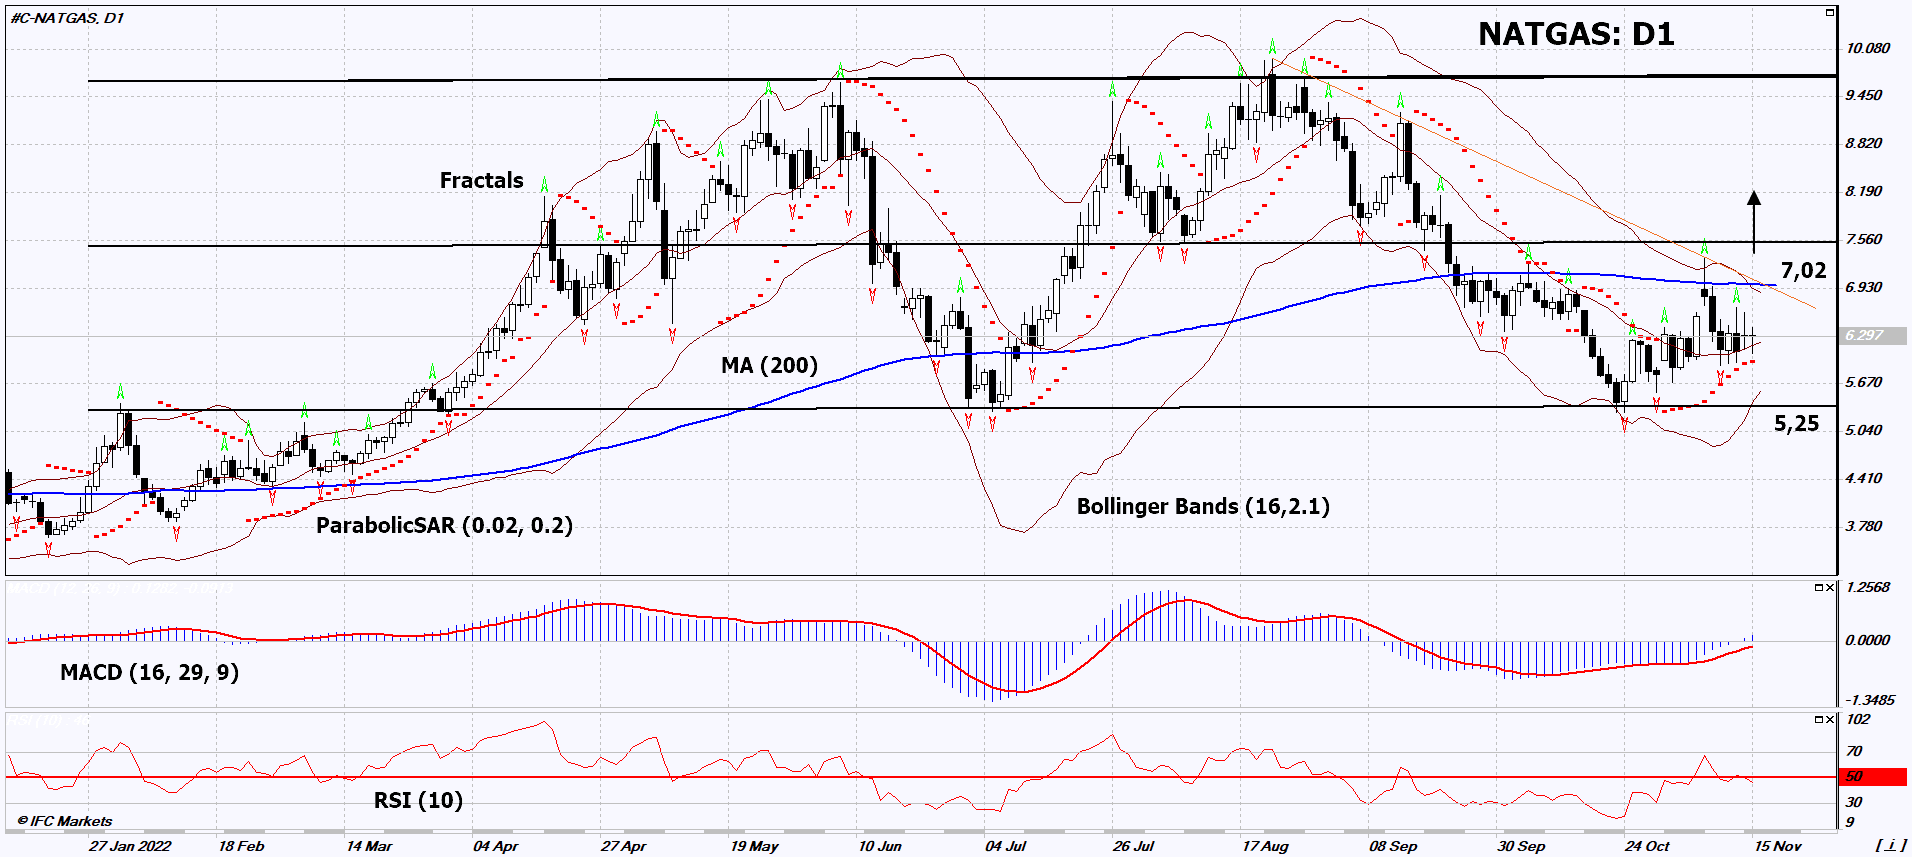
On the daily timeframe, NATGAS: D1 failed to break down the lower boundary of the neutral channel and is moving towards its upper boundary. A number of technical analysis indicators formed signals for further growth. We do not rule out a bullish movement if NATGAS: D1 rises above its latest up fractal, upper Bollinger band and 200-day moving average line: 7.02. This level can be used as an entry point. The initial risk limit is possible below the Parabolic signal, the lower Bollinger band and the last 3 lower fractals: 5.25. After opening a pending order, we move the stop following the Bollinger and Parabolic signals to the next fractal low. Thus, we change the potential profit/loss ratio in our favor. The most cautious traders, after making a trade, can switch to a four-hour chart and set a stop loss, moving it in the direction of movement. If the price overcomes the stop level (5.25) without activating the order (7.02), it is recommended to delete the order: the market is undergoing internal changes that were not taken into account.
Análisis fundamental de Materias Primas - Gas Natural
Cooler temperatures are expected in Europe and the US. Will NATGAS quotes increase?
Commodity Weather Group predicts a cold snap in the US. This may increase the demand for natural gas for heating. Temperatures are also expected to drop in Europe. Frosts are possible in Germany. Natural gas quotes on the ICE Dutch TTF rose to $1,300 per 1,000 cubic meters. Another positive factor may be the data from the U.S. Energy Information Administration on an increase in natural gas consumption in the United States in 2021 by 3.6% compared to 2020. This was mainly due to increased exports of US liquefied natural gas (LNG). The agency also notes that this trend has continued in 2022. The US has become the world's largest exporter of LNG. In the 1st half of 2022, its shipments from the US increased by 12% compared to the 2nd half of 2021 and reached 11.2 billion cubic feet per day.
Explore nuestras
Condiciones de Trading
- Spreads desde 0.0 pip
- 30,000+ Instrumentos de Trading
- Ejecución Instantánea
¿Listo para Operar?
Abrir Cuenta Nota:
Este resumen tiene carácter informativo-educativo y se publica de forma gratuita. Todos los datos que contiene este resumen, son obtenidos de fuentes públicas que se consideran más o menos fiables. Además, no hay niguna garantía de que la información sea completa y exacta. En el futuro, los resúmenes no se actualizarán. Toda la información en cada resumen, incluyendo las opiniones, indicadores, gráficos y todo lo demás, se proporciona sólo para la observación y no se considera como un consejo o una recomendación financiera. Todo el texto y cualquier parte suya, así como los gráficos no pueden considerarse como una oferta para realizar alguna transacción con cualquier activo. La compañía IFC Markets y sus empleados en cualquier circunstancia no son responsables de ninguna acción tomada por otra persona durante o después de la observación del resumen.


