- 교육
- 외환거래 전략
외환거래 전략
거래에서 이길 수 있는 가장 강력한 수단 중 하나는 다양한 상황에서 트레이더가 적용한 외환 거래 전략 포트폴리오입니다. 항상 단일 시스템을 따르는 것만으로는 성공적인 거래를 하기에 충분하지 않습니다. 각각의 트레이더는 모든 시장 상황에 대처하는 방법을 알아야하지만 그렇게 쉬운 일이 아니며, 경제에 대한 깊은 연구와 이해가 필요합니다.
IFC Markets은 귀하의 교육 요구를 충족하고 자신의 거래 전략 포트폴리오를 만들 수 있도록 거래에 대한 신뢰할 수있는 자료를 제공하고, 성공적인 트레이더들이 적용한 인기있고 간단한 외환 거래 전략에 대한 완전한 정보를 제공합니다.
당사가 대표하는 거래 전략은 거래 초보자는 물론 기술을 향상시키고자 하는 모든 거래자에게 적합합니다. 아래 분류 및 설명된 모든 전략은 교육용이며 트레이더별로 다른 방식으로 적용 할 수 있습니다. 또한 가장 인기 있는 거래 수단 중 하나인 암호화폐 거래에 관심이 있을 수 있습니다. 암호화폐 거래에 대한 지식을 향상시키기 위해 암호화폐 거래 전략을 배울 수 있습니다.
Trading Strategies Based on Forex Analysis
Perhaps the major part of Forex trading strategies is based on the main types of Forex market analysis used to understand the market movement. These main analysis methods include technical analysis, fundamental analysis and market sentiment.
Each of the mentioned analysis methods is used in a certain way to identify the market trend and make reasonable predictions on future market behaviour. If in technical analysis traders mainly deal with different charts and technical tools to reveal the past, present and future state of currency prices, in fundamental analysis the importance is given to the macroeconomic and political factors which can directly influence the foreign exchange market. Quite a different approach to the market trend is provided by market sentiment, which is based on the attitude and opinions of traders. Below you can read about each analysis method in detail.
Forex Technical Analysis Strategies
Forex technical analysis is the study of market action primarily through the use of charts for the purpose of forecasting future price trends. Forex traders can develop strategies based on various technical analysis tools including market trend, volume, range, support and resistance levels, chart patterns and indicators, as well as conduct a Multiple Time Frame Analysis using different time-frame charts.
Technical analysis strategy is a crucial method of evaluating assets based on the analysis and statistics of past market action, such as past prices and past volume. The main goal of technical analysts is not the measuring of asset’s underlying value, they attempt to use charts or other tools of technical analysis to determine patterns that will help to forecast future market activity. Their firm belief is that the future performance of markets can be indicated by the historical performance.
PRACTICE MAKES PERFECT
Forex Trend Trading Strategy
What is Trend Trading
A trend is nothing more than a tendency, a direction of market movement, i.e. one of the most essential concepts in technical analysis. All the technical analysis tools that an analyst uses have a single purpose: help identify the market trend. The meaning of the Forex trend is not so much different from its general meaning - it is nothing more than the direction in which the market moves. But more precisely, foreign exchange market does not move in a straight line, its moves are characterized by a series of zigzags which resemble successive waves with clear peaks and troughs or highs and lows, as they are often called.
Trend trading is considered a classic trading strategy, as it was one of the first of them, and takes its rightful place today. We believe that trend trading will remain relevant among traders around the world in the future. All thanks to three main, but simple principles:
- Buy when the market goes up, i.e. we are seeing an uptrend/bullish trend
- Sell when the market goes down, i.e. we are seeing a downtrend/bearish trend
- Wait and take no action when the market moves neither up nor down, but horizontally, i.e. we are seeing a sideways trend/consolidation
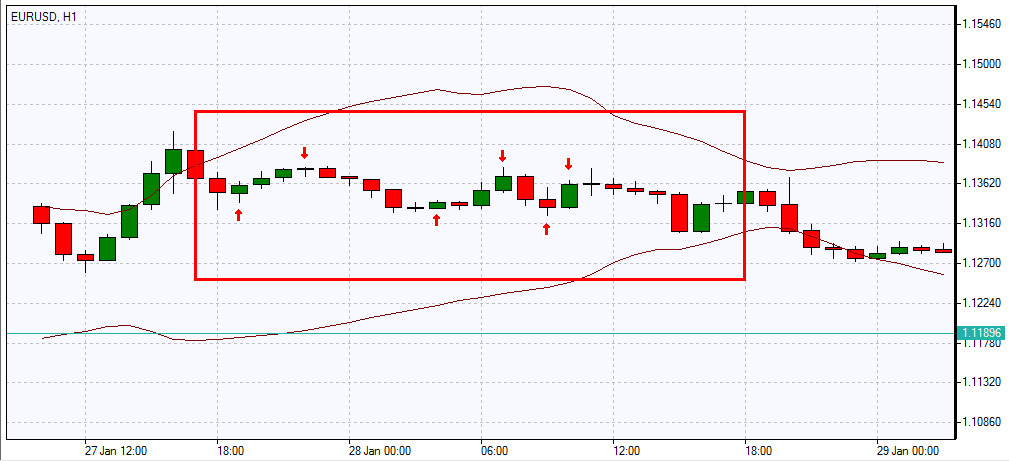
Sideways trend
The trend following strategy can be applied to trade on a wide variety of timeframes, but the most accurate forecasts and lower risks relate to medium and long-term trading, where stronger and long-lasting trends are observed. Trend trading can be the best choice for swing traders, position traders, i.e. those who see and predict the direction of the market movement in the future. However, both scalpers and day traders also catch trends, but less strong and very short-lived, a sort of fluctuations within the main trend.
Any trader, regardless of their trading method, must first of all use technical analysis to determine the current trend in the market of a traded asset and try to predict its further development, using technical analysis. The technical analysis tools applied are usually extremely simple and user-friendly, each trader can select a variety of indicators, lines, time frames, etc., based on the characteristics of the asset they invest in, their individual preferences and other factors. However, the most commonly used ones are moving averages of different periods, Bollinger bands, the Alligator indicator, Ichimoku cloud, Keltner channels, MACD and ADX indicators, as well as various advanced modifications of classic indicators. Since the indicators are inherently lagging, i.e. reflect the impact of past events and market movements, it is also important to use oscillators to predict the development of the trend and identify the entry points, set stop loss, take profit, trailing stop orders correctly.
Here are three main techniques for entering the market:
- Classic (i.e., entering the market at the intersection of two moving averages)
- At a breakout (i.e., placing a pending order and entering the market after confirming the price intention to continue the trend)
- At a retreat (i.e., entering the market not immediately by a trading signal, but later, when the price is at a more favorable level)
Breakout and classic techniques have some similarities, for example, in both cases the absence of a take profit order and the setting of a trailing stop would be a rational decision. Entering the market at a retreat is riskier, since there is no guarantee the trend will continue as intended rather than reverse.
But back to the types of trends in Forex. According to the theory of supply and demand, the market has 4 main phases of development:
- Accumulation (sideways movement, consolidation).
- Markup (bullish trend/uptrend).
- Distribution (sideways movement, consolidation).
- Markdown (bearish trend/downtrend).
In fact, on a two-dimensional chart, the trend can move up (phase №2), down (phase №4), or remain relatively horizontal (phases №1 and №3). Let's go through each of the types of trends in Forex separately.
An uptrend, or bullish trend, is a movement in the price of an asset when the lows and highs progressively increase, i.e. every next maximum/minimum is higher than the previous maximum/minimum. In fact, the bullish trend identifies a growth in price on a specific timeframe. As a rule, traders begin to actively buy exactly on the ascent of the trend line, but often they open positions when the bullish bias reaches its peak and flows into the phase of distribution, in which the price moves horizontally and prepares for the final phase of the bullish trend.
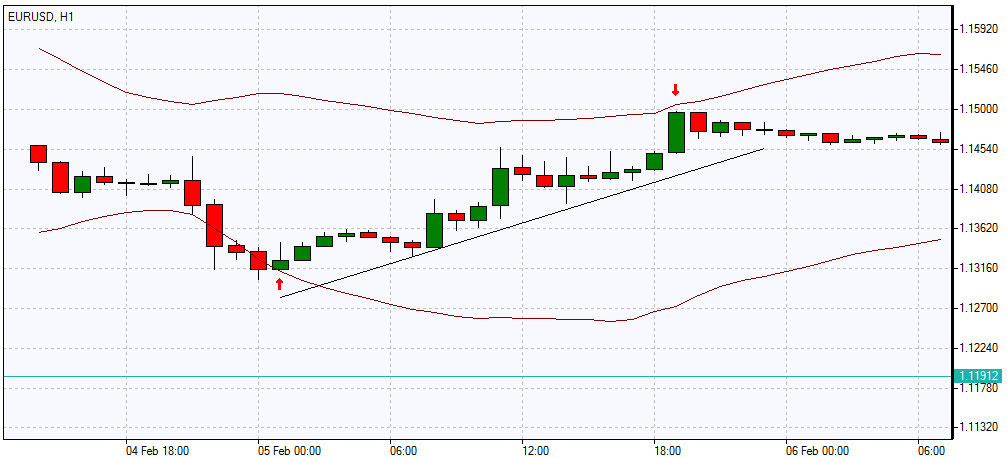
Bullish trend
However, non-professional traders hold their positions longer than necessary at the end of an uptrend, hoping for the trend to continue, and often move into drawdown and lose their investments. More experienced traders manage to correctly detect the end of the 1st market phase, i.e. just before the price advances, and open long positions. Short positions are opened either during the distribution phase or at the very beginning of the 4th phase when the trend reverses. The current bullish trend can be detected by drawing the support line at the low points: the price bounces up at the lows, as if pushing off the support line, thereby increasing the highs. If the support line vector on the chart is pointing up, then this is definitely an uptrend.
A downtrend, or bearish trend , is a movement in the price of an asset when the lows and highs consistently decrease, every next maximum/minimum is lower than the previous maximum/minimum. In fact, the bearish trend identifies a fall in price on a particular timeframe. The downtrend goes through the same phases and in the same sequence as an uptrend: accumulation of positions, stabilization of the trend, distribution (consolidation).
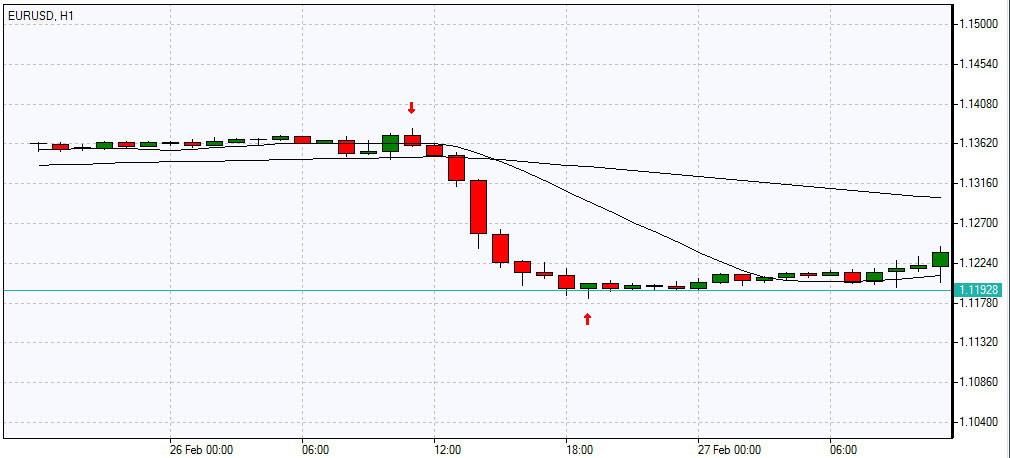
Bearish trend
However, if traders go long during the uptrend, then the downtrend implies the opening of short positions, and it is important to set sell orders (including pending orders) within the distribution phase at the desired price. In a downtrend, the trend line (in this case, the resistance line) is drawn along the tops: the price, as if meeting resistance, repels and tends downward, then, with a slight correction, rises back to the support line and bounces off. If the resistance line vector on the chart is directed downward, then this is definitely a downtrend.
There is an expression popular among traders: “Trend is your friend” which applies to both the uptrend and the downtrend. However, we can observe an apparent trend only 20-30% of the time, the rest of the time the market is relatively neutral and remains flat, i.e.the price is traded in a narrow range, shifting between resistance and support lines. A sideways trend, or consolidation, occurs when the potential of bears and bulls becomes equal, this often happens before the release of important macroeconomic and other news, since traders do not know exactly how this news will affect the movement of the asset’s price. That is why the sideways trend acts as the first and third market phases when positions are accumulated and distributed. Also, sideways movement occurs due to the lack of players in the market between trading sessions or during trading of any asset at an atypical time for it (for example, when trading a European currency pair before the opening of the European session). Trading in a sideways trend is possible, but extremely risky. Such a movement will work more for scalpers who make money precisely from small and frequent fluctuations within predictable limits.
Let's sup up the above with a few remarks:
- Trend is your friend, definitely. But you shouldn’t trade without taking into account the main principles of money and risk management and in the absence of a well-thought-out strategy.
- The Forex trend trading is inherently simple, but this doesn’t mean it is inefficient. The complexity of trading strategies would only hinder the trader.
- At least 2 timeframes are required to identify the trend more reliably.
- You can visually understand the direction of the trend as follows: the price from the lower left corner rises to the upper right corner - a bullish trend; the price from the upper left corner falls to the lower right corner - a bearish trend; the price moves flat and horizontally - a sideways trend.
- The market moves horizontally about 70% of the time, but trading with such a movement is not worth it unless you have experience and a clear understanding of the market behavior during the accumulation and distribution phases.
- The more often the price meets the resistance/support line and, repelling, keeps the movement vector, the stronger and more stable the trend.
- If the price goes up/down sharply and steeply, the trend is more likely to reverse. If the trend is flatter, evenly rising/falling, then there is a high probability that it will last long.
NEW TO TRADING OR WANT TO
IMPROVE YOUR LEVEL?
Check out our Trading Academy with
professional video lessons
and articles.
Support and Resistance Trading Strategy Guide
What are the Support and Resistance lines and how to draw them on a chart?
Among the fundamental and most commonly used technical analysis tools, support and resistance (SR) levels have a special place. Moreover, strategies based on them are used not only by beginners, but also by quite experienced traders, who have many other tools at their disposal, as well as extensive trading experience. So why have these simple lines become so widely used by investors? Let's think about this together.
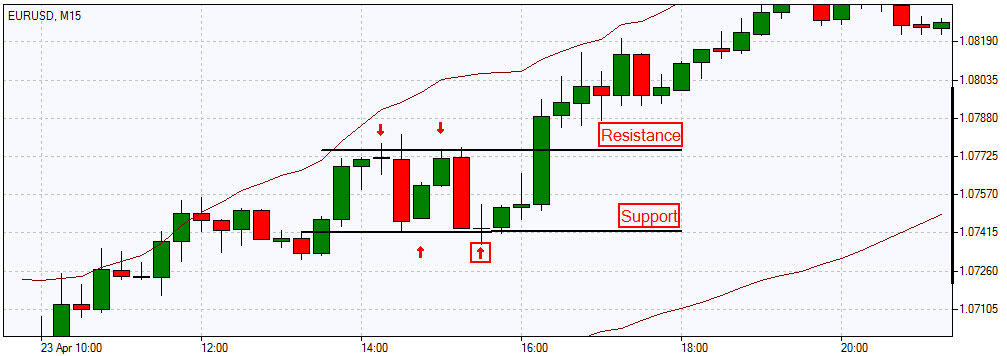
SR levels are conditional areas that each trader allocates individually by the price extremes - minimums and maximums, on a certain timeframe. These areas are often represented as lines, however, to calculate all the risks and correctly place orders, it is still better to depict the SR as areas on the chart. It should be known that support and resistance lines on different timeframes will be drawn in completely different ways. It's worthy to note that SR lines on large timeframes, such as H1, H4, D1 and larger, are more reliable and less likely to be broken through, the same cannot be said for the SR lines drawn on M1, M5 or M15. There are no specific rules about whether to draw levels by candlestick bodies or by their shadows: experts have not yet agreed on this issue.
Reasons for the formation of Support and Resistance Areas
To understand how Support & Resistance levels are formed and how to use them, we need to analyze the psychological component of this phenomenon. A market trend formation depends on the prevalence of one of three conditional groups in the market:
- Bears (open sell positions)
- Bulls (open buy positions)
- Undecideds (not yet on the market)
Imagine a situation with the price fluctuating in a consolidation area near the support line. Bears sell assets, bulls actively buy, and then the price begins to rise. In such a situation, the bears regret going short, and as soon as the price returns to the support line, they will close their orders to have a chance to break even. The bulls are happy with this scenario, since their positions get profitable when the price rises, and at the very first correction of the price to the support line, they will go long again, as they believe the price will bounce off the support level one more time. Those traders who haven’t yet opened orders see that the sideways trend has turned upward and consider the moment of price correction and its rebound from the support level the most favorable for placing buy orders. Thus, we see a clear BUY sentiment among traders at the very first, even slight price movement towards the support line. And when this happens, a huge number of market participants immediately go long, i.e. demand surges sharply, and supply does not keep pace with it, so the price rises as expected. The situation is reversed in the case of the resistance line, where supply rises steeply and demand slips downwards. With such a common example, we can see a direct relationship between the Supply/Demand ratio and the Support/Resistance levels vector. This is why Support/Resistance lines are often called Supply/Demand levels.
How to trade using support and resistance levels?
We have sorted out the reasons how the S/R areas form. Now let's look at trading strategies based on support and resistance levels. When on the chart the price approaches the support or resistance line, it is expected to either bounce off that line or break it. So, traders distinguish 3 types of trading based on the Support/Resistance levels: trading based on a rebound from levels (range trading), trading based on a level breakout, and a mixed type of trading (allows you to use both strategies alternately, depending on the current market situation). Let’s consider the two key strategies:
Range Trading
From the example above, it can be seen that with a significant accumulation of bullish potential, as the price approaches the support line, it is more likely that the price will reverse from the level. Then you can go long, placing the stop loss below the support level. When the price moves towards the resistance line, and bearish sentiments prevail in the market, traders begin to actively open sell orders, as soon as the price reaches the Resistance level. As a result, the price bounces off the level and goes down. In this case, the stop loss is usually placed above the resistance level. Using a take profit order and trailing stop mode also reduces the risk of losses and helps to fix profits in time. A rebound from levels occurs most often within consolidation (actually, the market is in this phase about 70% of the time), since the price alternately bounces from one level to another, so such trading is quite attractive for scalpers and short-term traders: insignificant profit per trade is compensated by the frequency of orders.
Breakout Trading
With large volumes in the market and a strong trend movement, the price may break through the support or resistance line, instead of reversing from it. Trend traders benefit the most from this price behavior.
- If the price breaks the resistance level from the bottom up, then returns to this level during correction, the price is not always able to punch it from the other side, so it bounces up from the level, forming an upward trend. Thus, after the breakout the resistance line turns into a support line.
- If the price breaks through the support line from top down, and upon returning to this line, the price isn’t always able to break it from the opposite side now, so it ricochets off the level and continues its downward movement, becoming a downtrend. In this case, the support line is transformed into a resistance line after the breakout.
- In some cases, after breaking through the support/resistance level once, the price crosses it back from the opposite side during the correction and returns to the previous price range. It's called a false breakout.
Key Takeaways of Support and Resistance Trading
- Trading based on support and resistance levels is suitable for all types of markets: currency, commodity, stock. Also, it is applicable to any timeframe.
- The principles of such trading are simple and straightforward.
- It is easy to identify support and resistance zones with the help of moving averages and trend lines on any timeframe. They often act as Support/Resistance levels themselves.
- Levels are a universal tool for technical analysis. They are unbiased, since most traders are guided by them.
- The more often a level is tested, the stronger it is considered. However, you need to be extremely careful in order to timely notice changes in the trend and its possible reversal.
- Several false breakouts indicate the stability and strength of the level.
- Fibonacci levels, moving averages of at least two large periods with round numeric values, the Lines algorithm, the PZ and IchimokuSuppRes indicators, Pivot Points, Bollinger Bands, Fractals and many others can help identify the S/R areas.
In conclusion, it’s worth noting that the concepts of Support and Resistance levels are not new in trading; many investors are guided by them and build their strategies accordingly. However, there are also those who believe that the levels based on old data may be useful in analyzing the market development in the past, but not in predicting the future movements, since there are no guarantees that the market will behave in one way or another, because there are plenty of factors influencing the market, and the behavior of millions of market participants is unpredictable.
PRACTICE MAKES PERFECT
Forex Range Trading Strategy
Range trading strategy, which is also called channel trading, is generally associated with the lack of market direction and it is used during the absence of a trend. Range trading identifies currency price movement in channels and the first task of this strategy is to find the range. This process can be carried out by connecting a series of highs and lows with a horizontal trendline. In other words, the trader should find the major support and resistance levels with the area in between known as “trading range”.
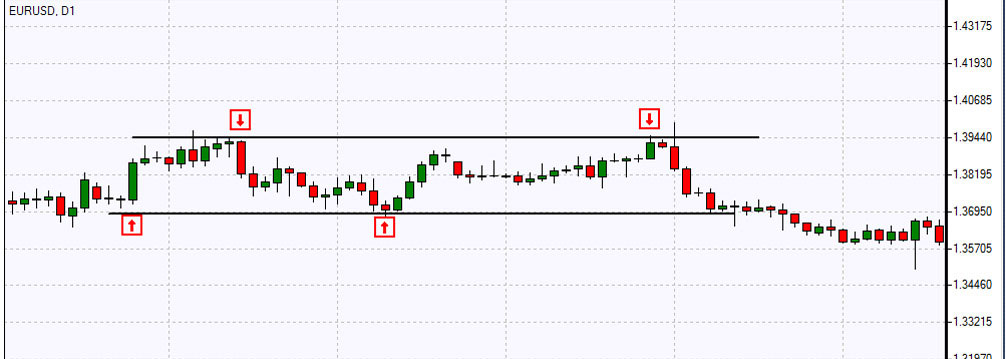
In range trading it’s quite easy to find the areas to take profit. You can buy at support and sell at resistance as long as the security hasn’t broken out of the channel. Otherwise, if the breakout direction is not favorable for your position, you may undergo huge losses.
Range trading actually works in a market with just enough volatility due to which the price goes on wiggling in the channel without breaking out of the range. In the case the level of support or resistance breaks you should exit range-based positions. The most efficient way of managing risks in range trading is the use of stop loss orders as most traders do. They place sell limit orders below resistance when selling the range and set the take profit down near support. When buying support they place buy limit orders above support and place take profit orders near the previously identified resistance level. And risks can be managed by placing stop loss orders above the resistance level when selling the resistance zone of a range, and below the support level when buying support.
Technical Indicators in Forex Trading Strategies
Technical indicators are calculations which are based on the price and volume of a security. They are used both to confirm the trend and the quality of chart patterns, and to help traders determine the buy and sell signals.The indicators can be applied separately to form buy and sell signals, as well as can be used together, in conjunction with chart patterns and price movement.
Technical analysis indicators can form buy and sell signals through moving average crossovers and divergence. Crossovers are reflected when price moves through the moving average or when two different moving averages cross each other. Divergence happens when the price trend and the indicator trend move in opposite directions indicating that the direction of price trend is weakening.
They can be applied separately to form buy and sell signals, as well as can be used together, in conjunction with the market. However, not all of them are used widely by traders. The following indicators mentioned below are of utmost importance for analysts and at least one of them is used by each trader to develop his trading strategy:
- Moving Average
- Bollinger Bands
- Relative Strength Index (RSI)
- Stochastic Oscillator
- Moving Average Convergence/Divergence (MACD)
- ADX
- Momentum
You can easily learn how to use each indicator and develop trading strategies by indicators.
FX 차트 거래 전략
차트는 FX 기술 분석을 위해 특정 기간 동안의 가격 움직임을 그래픽으로 표현한 것으로 한 달 또는 1년 동안의 환율 변동을 한눈에 볼 수 있습니다. 거래자가 검색하고자 하는 정보와 알고 있는 지식에 따라 막대 차트, 선형 차트, 캔들 스틱 차트, 포인트 차트, 그림 차트 등 특정 유형의 차트를 사용합니다.
또한 다음과 같은 기술 차트 패턴으로 특정 전략을 개발할 수도 있습니다.
- 삼각형
- 플래그
- 페넌트
- 쐐기형
- 직사각형 패턴
- 머리어깨형 (Head & Shoulder)
- 더블 탑 더블 바텀 (Double Tops and Double Bottoms)
- 트리플 탑 트리플 바텀 (Triple Tops and Triple Bottoms)
차트 읽는 방법을 배워 차트 패턴별 거래 전략을 개발할 수 있습니다.
Forex Volume Trading Strategy
Volume shows the number of securities that are traded over a particular time. Higher volume indicates higher degree of intensity or pressure.Being one of the most important factors in trade it is always analyzed and estimated by chartists. In order to determine the upward or downward movement of the volume, they look at the trading volume gistograms usually presented at the bottom of the chart. Any price movement is of more significance if accompanied by a relatively high volume than if accompanied by a weak volume.
By viewing the trend and volume together, technicians use two different tools to measure the pressure. If prices are trending higher, it becomes obvious that there is more buying than selling pressure. If the volume starts to decrease during an uptrend, it signals that the upward trend is about to end.
As mentioned by Forex analyst Huzefa Hamid "volume is the gas in the tank of the trading machine". Though most traders give preference only to technical charts and indicators to make trading decisions, volume is required to move the market. However, not all volume types may influence the trade, it’s the volume of large amounts of money that is traded within the same day and greatly affects the market.


